Gold Sortino Ratios: Define the Target and the Downside Denominator
Calculate target downside deviation under an explicit full-sample convention and show how changing the required return changes the result.
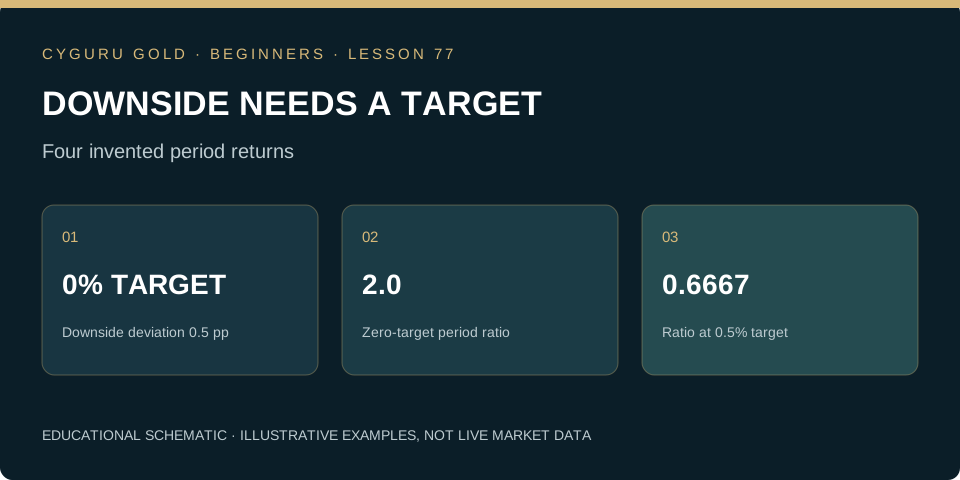
Downside is defined relative to a target
A Sortino-style ratio compares average return above a selected target with a measure of shortfall below that target. The target can represent a required return under a documented convention; it is not automatically zero or a universal risk-free rate. Different implementations can use different denominators and annualization choices. State the observation frequency, return definition, target and downside-deviation formula before comparing outputs. The purpose is to measure one particular form of variability. It does not imply that every other source of loss, funding stress or uncertainty has been accounted for.
Calculate full-sample target downside deviation
Use invented period returns of −1%, +1%, +2% and +2%, whose arithmetic mean is +1%. Set the target at 0% per period. For the chosen full-sample RMS convention, record min(return minus target, zero) for every observation: −1, 0, 0 and 0 in percentage points. Square them, average over all four observations and take the square root. Downside deviation is sqrt(1/4)=0.5 percentage point. The ratio is (1−0)/0.5=2.0 for the stated period. This is not the result obtained by dividing only by the count of negative observations.
Change the target and recompute every component
Raise the hypothetical required return to 0.5% per period. The shortfall observations become −1.5, 0, 0 and 0; full-sample RMS downside deviation becomes sqrt(2.25/4)=0.75 percentage point. Mean return above target is now 0.5, so the ratio is 0.5/0.75, approximately 0.6667. The underlying return series is unchanged, yet the metric changes materially because the objective changed. Do not compare a zero-target ratio with another strategy’s positive-target ratio as if both were the same risk-adjusted measurement. Preserve target units and period alignment in the worksheet.
| Quantity | Target 0% | Target 0.5% |
|---|---|---|
| Mean above target pp | 1 | 0.5 |
| Squared shortfall sum | 1 | 2.25 |
| Observation divisor | 4 | 4 |
| Downside deviation pp | 0.5 | 0.75 |
| Period ratio | 2 | 0.6667 |
Understand how a quiet downside denominator can mislead
If no sample observation falls below the target, the downside denominator can be zero. The resulting undefined or specially handled ratio does not establish the absence of future downside. A short or selectively chosen sample may simply omit adverse states. Illiquid or stale valuations can also suppress observed shortfalls. Report sample size, target-breach count, worst outcomes and the path of equity. A method exposed to rare jumps needs a stress analysis beyond a ratio. The absence of a sampled tail loss is a limitation of the evidence, not a guarantee supplied by the formula.
Separate this statistic from Sharpe and loss probability
Sharpe and Sortino differ in what they place in the denominator and, potentially, which reference enters the numerator. They need not rank the same methods identically. Neither is a direct estimate of the chance of losing on the next trade. A desired target chosen after seeing the results can manufacture a favorable presentation. Annualizing a period ratio also requires explicit assumptions about how the monitored returns behave over time. Keep the unannualized components visible. When the mean is below the target, inspect the negative numerator and the economic outcome rather than mechanically treating a larger negative ratio as a superior opportunity.
Practice task: audit two platform conventions
Reproduce 2.0 at a zero target and 0.6667 at a 0.5% target using all four observations in the RMS denominator. Then calculate what happens if a report divides only by the single below-target observation and explain why that convention differs. Do not label the mismatch a software bug without reading its documentation. Prepare a specification containing target, return frequency, denominator, costs, cash treatment and annualization. Finish by naming one loss scenario that the four observations do not contain. The resulting memo should explain the statistic precisely without turning a favorable downside ratio into a broad claim of safety.
Can you apply the idea?
Answer three questions, then check the explanation for every answer. You can repeat the check after reviewing the lesson.
Knowledge check: not attempted
Make this lesson part of your process.
Finish the reading and its practice task, then mark the lesson as completed.
0 of 100 lessons completed
Gold Trading Mastery
From gold market fundamentals to technical analysis, execution, quantitative research and AI. A structured 160-chapter course.
Explore the book →Continue the beginner course
What Is XAU/USD? Gold Trading Explained for Beginners →
How to Read Gold Candlestick Charts: A Beginner’s Guide →
Market, Limit and Stop Orders in Gold Trading →
Gold Trading Costs: Spread, Slippage and Financing →
Stop-Loss and Take-Profit in Gold: Beginner Essentials →
Your First Gold Trading Plan: Practise Before Going Live →
Gold Position Sizing: Calculate Exposure Before You Trade →
Gold Leverage and Margin: Understand the Difference →
Support and Resistance in Gold: Read Zones Without Guessing →
Gold and the Economic Calendar: CPI, Jobs and the Fed →
Multiple-Timeframe Gold Analysis: Context, Setup and Trigger →
Gold Trading Expectancy: Evaluate Results Beyond Win Rate →
Gold Trends and Ranges: Identify the Market Before the Setup →
Gold ATR for Beginners: Measure Movement, Not Direction →
Gold Breakouts and Failed Breaks: Define the Evidence →
Gold Trading Drawdown: Understand Losses and Recovery →
How to Backtest a Gold Trading Rule Without Hindsight →
The Gold Pre-Trade Checklist: Turn a Plan into a Decision →
Gold Liquidity and Trading Sessions: Study the Conditions →
Audit a Gold Trade: Quotes, Triggers and Actual Fills →
Multiple Gold Positions: Measure the Combined Exposure →
Partial Exits and Breakeven Stops: Follow the Arithmetic →
Small Samples in Gold Trading: Describe the Uncertainty →
Your Gold Trading Review: Version the Rule Before Testing Again →
Gold Weight and Purity: Calculate the Fine Gold Content →
Gold Premiums and Buyback: Calculate the Round-Trip Hurdle →
Allocated and Unallocated Gold: Understand the Ownership Claim →
Gold Benchmarks and Spot Quotes: Compare Like with Like →
Gold Returns in Your Currency: Separate Metal and FX Effects →
Gold Futures Tick Value: Translate Price Moves into Money →
Gold Futures Daily Settlement: Follow the Cash Through the Account →
Gold COT Reports: Read Positioning Without Inventing a Signal →
Gold ETFs: NAV, Market Price and Tracking Difference →
Gold in a Portfolio: Calculate Weight Drift and Rebalancing →
Gold Moving Averages: Read Smoothing Without Predicting the Future →
Gold RSI: Momentum Is Not a Reversal Promise →
Gold Volume: Distinguish Ticks, Contracts and Coverage →
Gold Heikin Ashi Charts: Separate Display Prices from Fills →
Gold Indicator Repainting: Distinguish Live Signals from Confirmed History →
Gold Backtests: When One Candle Touches Both Stop and Target →
Gold TradingView Alerts: Audit the Saved Script Snapshot →
Gold Signal Webhooks: Verify Delivery, Freshness and Duplicates →
Gold Trading Returns: Add Money, Compound Percentages →
Gold Account Performance: Separate Deposits from Trading Gains →
Gold Realized Volatility: Calculate the Statistic and Audit Its Assumptions →
Gold Correlation: Align Returns Before Interpreting the Relationship →
Gold Event Studies: Measure the Reaction Without Inventing the Cause →
Gold Strategy Robustness: Count the Experiments Behind the Winner →
Gold Stress Tests: Model Gaps, Liquidity and Tail Losses Together →
Gold Options at Expiry: Separate Payoff, Premium and Exercise →
Gold Option Delta and Gamma: Estimate Exposure Without Freezing It →
Gold Implied Volatility: Separate the Price of Uncertainty from Direction →
Gold Futures Rolls: Reconcile Contract P&L with a Continuous Chart →
Gold Mining Shares: Understand the Business Behind the Metal Exposure →
Gold VWAP: Define the Anchor, Price Input and Volume →
Gold Bollinger Bands: Distinguish Price Dispersion from a Reversal Signal →
Gold MACD: Read the Line, Signal and Histogram as Different Comparisons →
Gold Donchian Channels: Use the Prior Window Without Circular Signals →
Gold Fibonacci Retracements: Audit the Anchors Before Trusting the Level →
Gold Position Accounting: Distinguish Net Exposure from Gross Tickets →
Gold Bracket Orders: Audit Partial Fills and Cancellation States →
Gold Trade Excursions: Measure MAE and MFE Without Rewriting the Past →
Gold Execution Shortfall: Reconcile Decisions, Fills and Unfilled Quantity →
Gold Strategy Monitoring: Separate Data Failures, Execution Drift and Method Decay →
Gold Open Interest: Follow the Contract Ledger Before Reading Sentiment →
Gold Order Books: Translate Displayed Depth into a Conditional Fill Estimate →
Gold Calendar Spreads: Calculate Relative-Maturity P&L and Leg Risk →
Gold Basis Risk: Explain Why a Futures Hedge Can Leave a Residual Loss →
Gold Lending and Lease Rates: Separate Metal Interest from Price Exposure →
Gold Assay and Authenticity: Separate a Purity Calculation from Evidence →
Gold Storage and Insurance: Reconcile the Inventory and the Protection →
Gold Inventory Hedging: Match Fine Ounces and Finance the Cash Path →
Gold and Currency Hedging: Separate Metal Exposure from the Conversion Leg →
Gold Capstone: Build One Report from Price, Basis, Costs and Liquidity →
Gold Profit Factor: Reconcile the Winning and Losing Dollars →
Gold Sharpe Ratios: Align Excess Returns, Frequency and Risk →
Gold Win Rates: Calculate a Confidence Interval and State Its Assumptions →
Gold Return Dependence: Keep the Sequence When Measuring Risk →
Gold Bootstrap Studies: Resample the Evidence Without Inventing New Markets →
Gold Walk-Forward Tests: Freeze Each Rule Before Its Next Evaluation →
Gold Research Universes: Keep Delisted Products and Historical Eligibility Visible →
Gold Performance Attribution: Separate Within-Condition Results from the Opportunity Mix →
Gold Performance Capstone: Audit a Claim from Signal Ledger to Account Equity →
Build a Gold Trading System: Write the Operating Charter Before the Signal →
Gold Setup Rules: Translate Chart Language into Testable Predicates →
Gold System States: Separate Eligibility, Submission, Exposure and Rearming →
Gold System Sizing: Reserve Risk and Check Whether a Trade Is Feasible →
Gold System Exits: Define Priority, Timeouts and Conflicting Events →
Release a Gold Paper System: Test the Runbook Before Increasing Exposure →
Gold Execution Hesitation: Distinguish a Missed Entry from a New Decision →
Gold Overtrading: Audit Eligibility Before Counting Activity →
Gold Losing Streaks: Prevent Recovery Pressure from Rewriting Risk →
Gold Rule Changes: Separate Emergency Repairs from Strategy Redesign →
Gold Trading Journals: Score Decision Quality Separately from Profit →
Gold Case Study: Audit a Trend-Continuation Trade from Context to Net Exit →
Gold Case Study: Accept a Failed Range Break Without Moving the Evidence →
Gold Case Study: Document a Valid No-Trade Decision Around a Scheduled Event →
Gold Case Study: Recover from a Lost Order Response Without Duplicating Exposure →
Gold Lesson 100: Complete the Paper-System Project and Defend Its Evidence →
Market Desk and position-risk calculator →
Position sizing explained → · Build a trading journal →
Lesson sources and further study
CME-hosted paper: Sortino ratio and full-sample target downside deviation
Core course references
CME Group: Gold Product Overview. Investor.gov: Types of Orders explains order concepts for stocks; check the execution rules of your specific gold instrument.
Gabriel Nicolaev — CyGuru · Published 7 November 2026. Educational material. Illustrative prices are not current quotes or trade recommendations.