Gold Trading Drawdown: Understand Losses and Recovery
Calculate drawdown and recovery requirements, distinguish account equity from balance and create a review process for losing streaks without revenge trading.
Measure the decline from a defined peak
Drawdown measures a decline from an earlier peak to a subsequent lower value. State what the series represents: account equity including open positions, closed-trade balance, or a strategy model. These can tell different stories. A balance curve can look unchanged while an open loss reduces equity substantially. Preserve consistent observation times and account for deposits or withdrawals when interpreting the record. Adding money does not demonstrate trading recovery, and removing money should not automatically be counted as a trading loss.
Recovery uses a smaller denominator
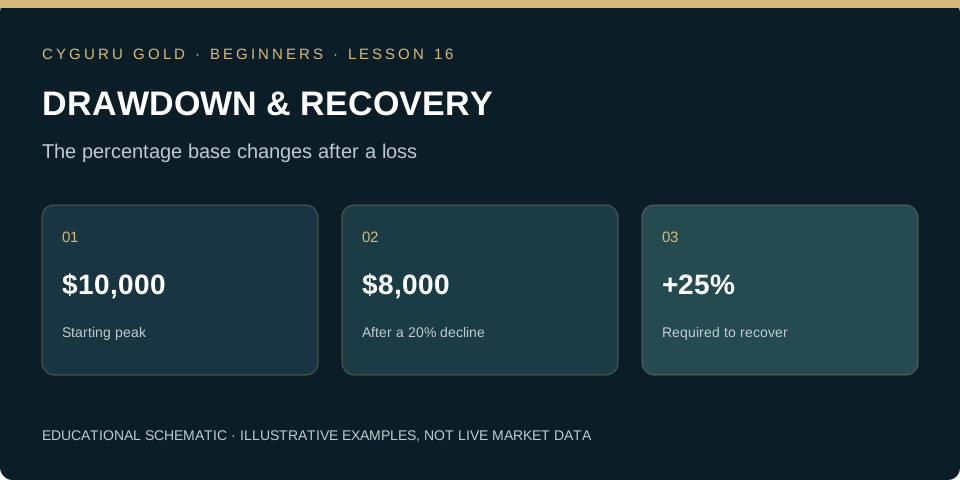
Consider an illustrative account declining from $10,000 to $8,000. The loss is $2,000, or twenty percent of the original peak. Recovering that $2,000 from $8,000 requires a twenty-five percent gain on the remaining amount. A fifty-percent drawdown requires a hundred-percent gain to return to the starting value. The general recovery fraction is the drawdown fraction divided by one minus that fraction, for drawdowns below one hundred percent. These relationships are arithmetic, not forecasts about whether recovery will occur or how quickly.
Separate fixed money risk from fixed percentage risk
With a fixed dollar amount, each planned loss takes a larger share of a shrinking account. With a fixed fraction of current equity, the amount decreases after losses, assuming the calculation is followed. For illustration, five exact one-percent losses from $10,000 leave approximately $9,509.90 before other effects. Five exact $100 losses leave $9,500. Actual trading rarely produces perfectly fixed losses because execution and costs vary. Neither sizing convention creates an edge, and the example’s fraction is not a recommended risk level.
A losing streak does not identify its own cause
Losses can reflect ordinary variation, changed market conditions, execution problems, an unprofitable method or rule violations. Their count alone does not reveal which explanation is correct. Raising quantity to recover faster increases financial sensitivity while leaving that uncertainty unresolved. Establish review triggers before the session: conditions for stopping new entries, checking open exposure and investigating the record. A session boundary limits intended behavior; it cannot guarantee an exact maximum loss during gaps or failed execution. Review outstanding orders as well as completed trades.
Practice task: build a recovery table and a review note
Calculate the gains required after hypothetical declines of five, ten, twenty and thirty percent. The approximate answers are 5.26, 11.11, 25 and 42.86 percent. Then inspect a practice losing sequence and label each trade as compliant, violated or unclear based on its original plan. Record costs and any movement beyond the intended exit. Decide what evidence is missing before changing the method. Read Before You Click for the behavioral side of recovery pressure and return to the expectancy lesson for evaluating the broader sample.
Can you apply the idea?
Answer three questions, then check the explanation for every answer. You can repeat the check after reviewing the lesson.
Knowledge check: not attempted
Make this lesson part of your process.
Finish the reading and its practice task, then mark the lesson as completed.
0 of 24 lessons completed
Before You Click
A practical guide to FOMO, revenge trading, stop interference and the moment before you place an order.
Explore the book →Continue the beginner course
What Is XAU/USD? Gold Trading Explained for Beginners →
How to Read Gold Candlestick Charts: A Beginner’s Guide →
Market, Limit and Stop Orders in Gold Trading →
Gold Trading Costs: Spread, Slippage and Financing →
Stop-Loss and Take-Profit in Gold: Beginner Essentials →
Your First Gold Trading Plan: Practise Before Going Live →
Gold Position Sizing: Calculate Exposure Before You Trade →
Gold Leverage and Margin: Understand the Difference →
Support and Resistance in Gold: Read Zones Without Guessing →
Gold and the Economic Calendar: CPI, Jobs and the Fed →
Multiple-Timeframe Gold Analysis: Context, Setup and Trigger →
Gold Trading Expectancy: Evaluate Results Beyond Win Rate →
Gold Trends and Ranges: Identify the Market Before the Setup →
Gold ATR for Beginners: Measure Movement, Not Direction →
Gold Breakouts and Failed Breaks: Define the Evidence →
How to Backtest a Gold Trading Rule Without Hindsight →
The Gold Pre-Trade Checklist: Turn a Plan into a Decision →
Gold Liquidity and Trading Sessions: Study the Conditions →
Audit a Gold Trade: Quotes, Triggers and Actual Fills →
Multiple Gold Positions: Measure the Combined Exposure →
Partial Exits and Breakeven Stops: Follow the Arithmetic →
Small Samples in Gold Trading: Describe the Uncertainty →
Your Gold Trading Review: Version the Rule Before Testing Again →
Market Desk and position-risk calculator →
Position sizing explained → · Build a trading journal →
Lesson sources and further study
Core course references
CME Group: Gold Product Overview. Investor.gov: Types of Orders explains order concepts for stocks; check the execution rules of your specific gold instrument.
CYGURU GOLD editorial · Published 27 October 2026. Educational material. Illustrative prices are not current quotes or trade recommendations.