Multiple-Timeframe Gold Analysis: Context, Setup and Trigger
Give each chart timeframe a clear job, manage conflicting signals and avoid changing intervals just to justify a gold trade.
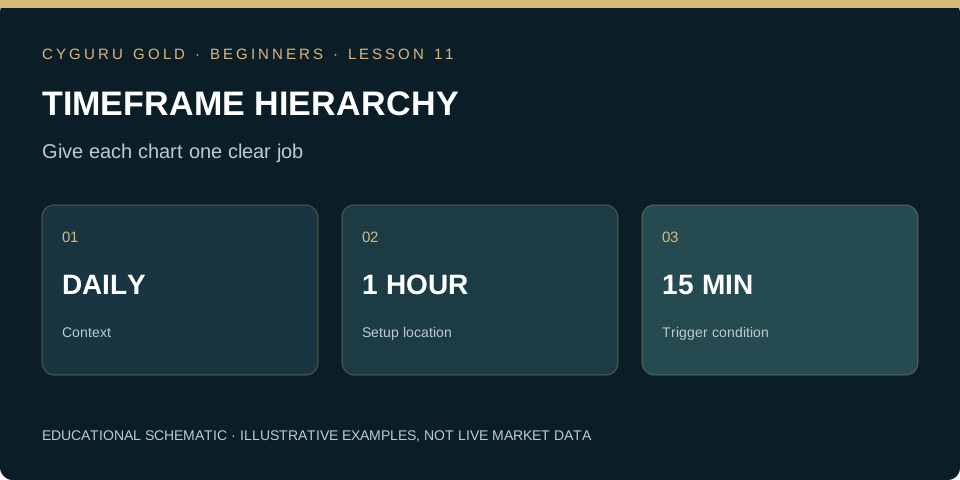
Give every chart a specific question
Multiple-timeframe analysis is useful only when the intervals have distinct roles. A broader chart can describe the surrounding structure; a middle interval can define the setup being studied; a smaller interval can describe the execution condition. Opening more charts without assigning those jobs adds information but not necessarily clarity. The same market can rise over a week and decline over an hour. These observations can coexist because they summarize different periods. Neither observation cancels the other, and neither dictates an order on its own.
Write a hierarchy before reading the outcome
For a practice exercise, you might use a daily chart for context, an hourly chart for setup location and a fifteen-minute chart for a trigger. This is an example of organization, not a recommended trading configuration. Specify whether the broader context restricts eligible directions or merely supplies background. Then decide what happens when the smaller interval conflicts with that rule. Without a hierarchy, a trader can always locate a chart that agrees with the desired action. A written hierarchy makes that change visible during review.
Keep unfinished information separate
A fifteen-minute candle may close several times while the corresponding hourly candle remains unfinished. Using the eventual hourly close to justify an earlier entry introduces information that was not available at the time. Record the timestamp and whether each observation came from a completed candle. The same principle applies to indicators referencing broader intervals. Understand how they update and whether historical plots differ from the values observed live. A visually neat historical alignment is not enough to establish that the signal could have been acted on as shown.
Avoid counting repeated information as independent evidence
Three moving averages on three related intervals may all reflect the same recent price move. Their agreement does not necessarily represent three independent confirmations. Treat indicator combinations as explicit rules to evaluate rather than votes that accumulate certainty. More filters can reduce the number of observations and make a method look selective without making it robust. When comparing versions, preserve the same evaluation period, costs and execution assumptions. Otherwise, an apparent improvement may result from changing the test rather than improving the decision rule.
Practice task: produce a three-line chart note
Write one sentence for context, one for setup location and one for the trigger requirement. Add a fourth line stating the condition for no trade. Keep the note unchanged while the chart develops, then review whether the roles were genuinely distinct. If one interval was used only after a loss to explain why the trade should not have happened, rewrite the process before the next practice session. Return to the support-and-resistance lesson for consistent zone marking and the demo-plan lesson for permission rules. Simplicity helps make the method testable.
Can you apply the idea?
Answer three questions, then check the explanation for every answer. You can repeat the check after reviewing the lesson.
Knowledge check: not attempted
Make this lesson part of your process.
Finish the reading and its practice task, then mark the lesson as completed.
0 of 24 lessons completed
The Gold Trader’s Code
100 trading rules, professional XAU/USD strategies and 50 case studies connecting analysis with risk and execution.
Explore the book →Continue the beginner course
What Is XAU/USD? Gold Trading Explained for Beginners →
How to Read Gold Candlestick Charts: A Beginner’s Guide →
Market, Limit and Stop Orders in Gold Trading →
Gold Trading Costs: Spread, Slippage and Financing →
Stop-Loss and Take-Profit in Gold: Beginner Essentials →
Your First Gold Trading Plan: Practise Before Going Live →
Gold Position Sizing: Calculate Exposure Before You Trade →
Gold Leverage and Margin: Understand the Difference →
Support and Resistance in Gold: Read Zones Without Guessing →
Gold and the Economic Calendar: CPI, Jobs and the Fed →
Gold Trading Expectancy: Evaluate Results Beyond Win Rate →
Gold Trends and Ranges: Identify the Market Before the Setup →
Gold ATR for Beginners: Measure Movement, Not Direction →
Gold Breakouts and Failed Breaks: Define the Evidence →
Gold Trading Drawdown: Understand Losses and Recovery →
How to Backtest a Gold Trading Rule Without Hindsight →
The Gold Pre-Trade Checklist: Turn a Plan into a Decision →
Gold Liquidity and Trading Sessions: Study the Conditions →
Audit a Gold Trade: Quotes, Triggers and Actual Fills →
Multiple Gold Positions: Measure the Combined Exposure →
Partial Exits and Breakeven Stops: Follow the Arithmetic →
Small Samples in Gold Trading: Describe the Uncertainty →
Your Gold Trading Review: Version the Rule Before Testing Again →
Market Desk and position-risk calculator →
Position sizing explained → · Build a trading journal →
Lesson sources and further study
CME Group: Risk Management and Your Trade Plan
Core course references
CME Group: Gold Product Overview. Investor.gov: Types of Orders explains order concepts for stocks; check the execution rules of your specific gold instrument.
CYGURU GOLD editorial · Published 27 October 2026. Educational material. Illustrative prices are not current quotes or trade recommendations.