Gold ATR for Beginners: Measure Movement, Not Direction
Understand true range and ATR with a worked gold example, then connect volatility observations to exposure without treating an average as a price limit.
Direction and movement size are different variables
A market can move sharply upward, sharply downward or violently in both directions. Volatility describes the magnitude of movement rather than choosing among those directions. Average True Range, or ATR, summarizes recent true ranges over a specified lookback using a smoothing method. It is a historical measurement, not a price forecast. TradingView’s documentation distinguishes ATR from directional indicators. Always record the chart interval, length and smoothing setting when comparing readings; a daily ATR and a fifteen-minute ATR answer different questions.
Calculate one true range by hand
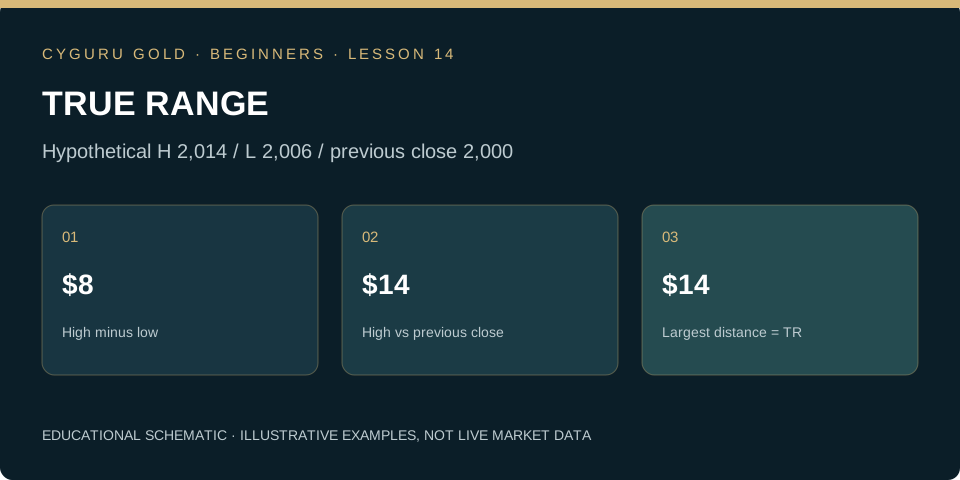
Imagine a completed gold candle with a high of $2,014, a low of $2,006 and a previous close of $2,000 per ounce. The high-low distance is $8. The absolute high-to-previous-close distance is $14, while the absolute low-to-previous-close distance is $6. True range is the largest of those three values: $14. Including the previous close captures a gap that the candle’s own $8 span would miss. These prices are invented for arithmetic. ATR then smooths a sequence of true ranges; one candle’s true range is not automatically the ATR.
Use the reading to ask better questions
Suppose a completed-candle ATR reading is $10 per ounce. A proposed $2 stop distance is small relative to that recent measure, while a $30 distance is larger. This comparison does not establish which exit is correct or how likely it is to be reached. The entry rule, invalidation logic, timeframe and observed outcomes still matter. Treat an ATR-based rule as a hypothesis to test under stated conditions. Selecting a multiplier because it looks convincing on one chart creates a neat number without establishing an advantage.
Recalculate quantity when the distance changes
A change in planned exit distance changes exposure arithmetic. With an illustrative $60 price-risk budget, a $10 distance supports six ounces before costs. A $15 distance supports four ounces under the same assumptions. Keeping six ounces after widening the stop raises the planned price loss to $90. That is a risk decision, not merely an indicator adjustment. Costs and possible adverse fills remain additional considerations. Revisit lesson seven before connecting any volatility measure to position size, and do not expand the risk budget to preserve a preferred quantity.
Practice task: compare observations without predicting a ceiling
Record ATR from completed candles across several different conditions identified in lesson thirteen. Note the settings and compare the observed candle ranges with the reading available beforehand. Some future movements will exceed a recent average. Reaching one ATR does not mean the market has exhausted a daily allowance or must reverse. Keep the comparison descriptive and avoid changing settings after each surprising result. The broader volatility guide in the journal extends the discussion; this lesson’s task is to understand the units, calculation and limits before using the number in a rule.
Can you apply the idea?
Answer three questions, then check the explanation for every answer. You can repeat the check after reviewing the lesson.
Knowledge check: not attempted
Make this lesson part of your process.
Finish the reading and its practice task, then mark the lesson as completed.
0 of 24 lessons completed
Gold Trading Mastery
From gold market fundamentals to technical analysis, execution, quantitative research and AI. A structured 160-chapter course.
Explore the book →Continue the beginner course
What Is XAU/USD? Gold Trading Explained for Beginners →
How to Read Gold Candlestick Charts: A Beginner’s Guide →
Market, Limit and Stop Orders in Gold Trading →
Gold Trading Costs: Spread, Slippage and Financing →
Stop-Loss and Take-Profit in Gold: Beginner Essentials →
Your First Gold Trading Plan: Practise Before Going Live →
Gold Position Sizing: Calculate Exposure Before You Trade →
Gold Leverage and Margin: Understand the Difference →
Support and Resistance in Gold: Read Zones Without Guessing →
Gold and the Economic Calendar: CPI, Jobs and the Fed →
Multiple-Timeframe Gold Analysis: Context, Setup and Trigger →
Gold Trading Expectancy: Evaluate Results Beyond Win Rate →
Gold Trends and Ranges: Identify the Market Before the Setup →
Gold Breakouts and Failed Breaks: Define the Evidence →
Gold Trading Drawdown: Understand Losses and Recovery →
How to Backtest a Gold Trading Rule Without Hindsight →
The Gold Pre-Trade Checklist: Turn a Plan into a Decision →
Gold Liquidity and Trading Sessions: Study the Conditions →
Audit a Gold Trade: Quotes, Triggers and Actual Fills →
Multiple Gold Positions: Measure the Combined Exposure →
Partial Exits and Breakeven Stops: Follow the Arithmetic →
Small Samples in Gold Trading: Describe the Uncertainty →
Your Gold Trading Review: Version the Rule Before Testing Again →
Market Desk and position-risk calculator →
Position sizing explained → · Build a trading journal →
Lesson sources and further study
TradingView: Average True Range definition and calculation
Core course references
CME Group: Gold Product Overview. Investor.gov: Types of Orders explains order concepts for stocks; check the execution rules of your specific gold instrument.
CYGURU GOLD editorial · Published 27 October 2026. Educational material. Illustrative prices are not current quotes or trade recommendations.