Support and Resistance in Gold: Read Zones Without Guessing
Learn to mark gold support and resistance as areas of observed price interaction, define failure conditions and avoid hindsight-driven chart analysis.
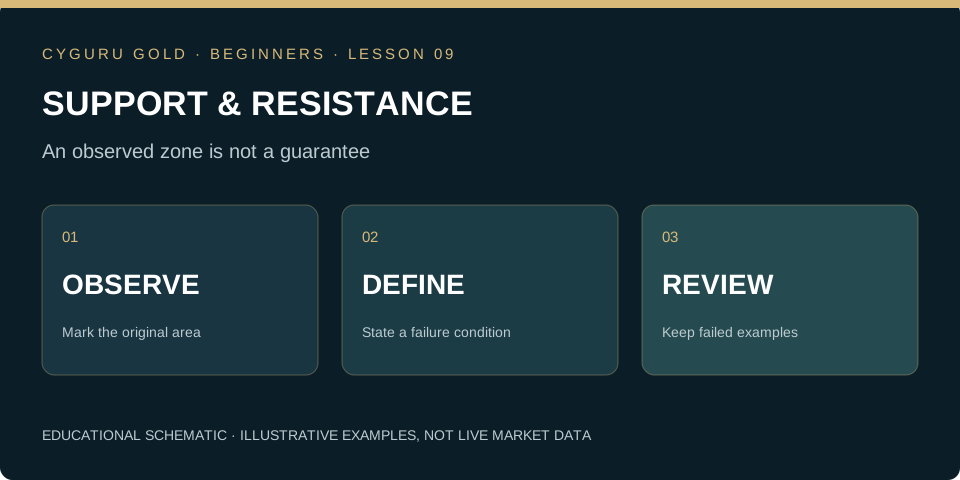
A zone records an observation
Support and resistance are descriptive labels for areas where price previously stalled, reversed or traded repeatedly. They are not physical barriers and do not identify the intentions of every participant. A previous high can attract attention without preventing a new high. Begin by writing what the chart actually shows: the timeframe, relevant swings and repeated interactions. This separates observation from prediction. A zone becomes useful for study when it helps define a conditional scenario that can be assessed later, including the possibility that price passes through it.
Draw fewer areas with clearer reasons
Select an observation window before marking the chart. Identify the most relevant recent swing areas and obvious range boundaries using a consistent rule. Avoid adding a new line to explain every candle. A chart covered with levels makes almost any future move look anticipated. Zones can accommodate nearby highs or lows, but their width should reflect a stated method rather than expand whenever the market disagrees. Preserve the original chart image so that later review does not quietly replace the area you actually observed.
Distinguish a touch from a trading condition
Price reaching a marked area is an event, not a complete entry method. A method still needs a defined response, an invalidation condition and an exposure calculation. For study, compare a touch-only hypothesis with one requiring a completed candle back inside a range. These are different rules and should produce separate records. Neither is automatically superior. Waiting for a close can avoid some premature interpretations while giving up location or missing a move. Describe that trade-off rather than presenting confirmation as a guarantee.
Study breaks and failures symmetrically
A move beyond resistance may continue, return to the old range or oscillate around the boundary. Calling every unsuccessful move a manipulation explains little unless the claim is supported by additional evidence. Use neutral labels such as break, close outside, return inside and continuation. Record examples that fail as carefully as those that work. If the rule needs three subsequent candles to qualify an event, do not pretend that classification was known at the first candle. Timing is part of the evidence, not an editorial detail.
Practice task: preserve the original drawing
Choose a historical chart and hide the later section. Mark two areas, record why each qualifies, and state what would contradict your scenario. Advance the chart without moving the original zones. Afterward, note whether the method was clear enough for another person to reproduce. This is a structured observation exercise, not a validation of profitable trading. Revisit lesson two for candle interpretation and lesson five for exit planning. The Gold Trader’s Code provides a broader framework for turning market descriptions into explicit decisions.
Can you apply the idea?
Answer three questions, then check the explanation for every answer. You can repeat the check after reviewing the lesson.
Knowledge check: not attempted
Make this lesson part of your process.
Finish the reading and its practice task, then mark the lesson as completed.
0 of 24 lessons completed
The Gold Trader’s Code
100 trading rules, professional XAU/USD strategies and 50 case studies connecting analysis with risk and execution.
Explore the book →Continue the beginner course
What Is XAU/USD? Gold Trading Explained for Beginners →
How to Read Gold Candlestick Charts: A Beginner’s Guide →
Market, Limit and Stop Orders in Gold Trading →
Gold Trading Costs: Spread, Slippage and Financing →
Stop-Loss and Take-Profit in Gold: Beginner Essentials →
Your First Gold Trading Plan: Practise Before Going Live →
Gold Position Sizing: Calculate Exposure Before You Trade →
Gold Leverage and Margin: Understand the Difference →
Gold and the Economic Calendar: CPI, Jobs and the Fed →
Multiple-Timeframe Gold Analysis: Context, Setup and Trigger →
Gold Trading Expectancy: Evaluate Results Beyond Win Rate →
Gold Trends and Ranges: Identify the Market Before the Setup →
Gold ATR for Beginners: Measure Movement, Not Direction →
Gold Breakouts and Failed Breaks: Define the Evidence →
Gold Trading Drawdown: Understand Losses and Recovery →
How to Backtest a Gold Trading Rule Without Hindsight →
The Gold Pre-Trade Checklist: Turn a Plan into a Decision →
Gold Liquidity and Trading Sessions: Study the Conditions →
Audit a Gold Trade: Quotes, Triggers and Actual Fills →
Multiple Gold Positions: Measure the Combined Exposure →
Partial Exits and Breakeven Stops: Follow the Arithmetic →
Small Samples in Gold Trading: Describe the Uncertainty →
Your Gold Trading Review: Version the Rule Before Testing Again →
Market Desk and position-risk calculator →
Position sizing explained → · Build a trading journal →
Lesson sources and further study
CME Group: Position and Risk Management
Core course references
CME Group: Gold Product Overview. Investor.gov: Types of Orders explains order concepts for stocks; check the execution rules of your specific gold instrument.
CYGURU GOLD editorial · Published 27 October 2026. Educational material. Illustrative prices are not current quotes or trade recommendations.