Gold COT Reports: Read Positioning Without Inventing a Signal
Distinguish COT observation dates, publication dates, report categories and net positioning using a hypothetical gold futures example.
Start with the report’s scope and date
The CFTC’s Commitments of Traders reports describe positions in specified reportable markets, with categories determined by the report format. They do not represent every gold owner or every transaction worldwide. Distinguish Futures Only from Futures and Options Combined and identify the specific market. The observation date and release date differ; consult the official schedule for delays. A report downloaded today can describe positions observed earlier. That delay matters before connecting the figures to a current chart.
Read long, short and spreading fields separately
A category’s net directional position is commonly calculated as long contracts minus short contracts, using the relevant fields and definitions. Spreading positions require their own treatment under the report methodology and should not be casually added as an outright bullish view. A category label describes a reporting classification; it does not tell you that every participant within it has the same motive. Hedging, portfolio construction and risk transfer can produce positions that a simple directional narrative cannot fully explain.
Calculate a change without inventing its cause
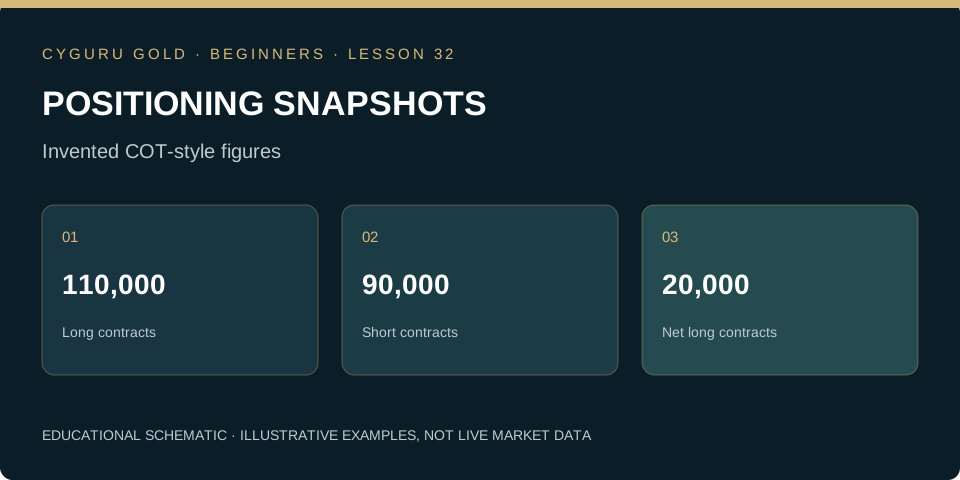
In an invented example, long positions rise from 100,000 to 110,000 contracts while shorts rise from 70,000 to 90,000. Net long exposure falls from 30,000 to 20,000 contracts even though gross longs increased. Reporting only the long increase would hide the change in shorts. The arithmetic establishes a difference between snapshots; it does not identify the exact prices, intentions or execution times behind it. Nor does it establish that a reversal must follow because the net figure reached a chosen level.
Use consistent denominators and history
If a hypothetical net position is 20,000 contracts against total open interest of 400,000, the simple ratio is 5%. That is a descriptive normalization, not the percentage of traders who are bullish. Comparing extremes across years requires consistent report formats, market definitions and an explicit lookback. Revised data and changing market size can affect interpretation. Avoid choosing the historical window solely because it makes today’s value look extreme. Any threshold used in a method needs evaluation separate from its visual appeal.
Practice task: annotate two snapshots
Build a fictional two-week table with long, short, net, total open interest, observation date and publication date. Reproduce the net decrease above and describe both the gross-long rise and the larger short increase. Label which information would have been available at each decision time. Write a conditional research question, such as whether a consistently defined positioning change adds information after costs, instead of translating the report directly into a buy or sell instruction. Link the exercise with the backtesting lesson to avoid looking ahead.
Can you apply the idea?
Answer three questions, then check the explanation for every answer. You can repeat the check after reviewing the lesson.
Knowledge check: not attempted
Make this lesson part of your process.
Finish the reading and its practice task, then mark the lesson as completed.
0 of 34 lessons completed
Gold Trading Mastery
From gold market fundamentals to technical analysis, execution, quantitative research and AI. A structured 160-chapter course.
Explore the book →Continue the beginner course
What Is XAU/USD? Gold Trading Explained for Beginners →
How to Read Gold Candlestick Charts: A Beginner’s Guide →
Market, Limit and Stop Orders in Gold Trading →
Gold Trading Costs: Spread, Slippage and Financing →
Stop-Loss and Take-Profit in Gold: Beginner Essentials →
Your First Gold Trading Plan: Practise Before Going Live →
Gold Position Sizing: Calculate Exposure Before You Trade →
Gold Leverage and Margin: Understand the Difference →
Support and Resistance in Gold: Read Zones Without Guessing →
Gold and the Economic Calendar: CPI, Jobs and the Fed →
Multiple-Timeframe Gold Analysis: Context, Setup and Trigger →
Gold Trading Expectancy: Evaluate Results Beyond Win Rate →
Gold Trends and Ranges: Identify the Market Before the Setup →
Gold ATR for Beginners: Measure Movement, Not Direction →
Gold Breakouts and Failed Breaks: Define the Evidence →
Gold Trading Drawdown: Understand Losses and Recovery →
How to Backtest a Gold Trading Rule Without Hindsight →
The Gold Pre-Trade Checklist: Turn a Plan into a Decision →
Gold Liquidity and Trading Sessions: Study the Conditions →
Audit a Gold Trade: Quotes, Triggers and Actual Fills →
Multiple Gold Positions: Measure the Combined Exposure →
Partial Exits and Breakeven Stops: Follow the Arithmetic →
Small Samples in Gold Trading: Describe the Uncertainty →
Your Gold Trading Review: Version the Rule Before Testing Again →
Gold Weight and Purity: Calculate the Fine Gold Content →
Gold Premiums and Buyback: Calculate the Round-Trip Hurdle →
Allocated and Unallocated Gold: Understand the Ownership Claim →
Gold Benchmarks and Spot Quotes: Compare Like with Like →
Gold Returns in Your Currency: Separate Metal and FX Effects →
Gold Futures Tick Value: Translate Price Moves into Money →
Gold Futures Daily Settlement: Follow the Cash Through the Account →
Gold ETFs: NAV, Market Price and Tracking Difference →
Gold in a Portfolio: Calculate Weight Drift and Rebalancing →
Market Desk and position-risk calculator →
Position sizing explained → · Build a trading journal →
Lesson sources and further study
CFTC: Official release schedule
Core course references
CME Group: Gold Product Overview. Investor.gov: Types of Orders explains order concepts for stocks; check the execution rules of your specific gold instrument.
Gabriel Nicolaev — CyGuru · Published 5 November 2026. Educational material. Illustrative prices are not current quotes or trade recommendations.