Gold ETFs: NAV, Market Price and Tracking Difference
Compare a gold fund’s market price, net asset value and benchmark return without assuming that every gold-labelled exchange-traded product holds bullion.
Identify the exposure behind the label
An exchange-traded product can hold physical metal, use derivatives or follow another gold-related approach. Shares of mining companies introduce business risks distinct from a bullion holding. Read the prospectus for structure, benchmark, custody, expenses, leverage and currency policy before calculating a return. The word gold in the product name does not settle these questions. This lesson compares hypothetical fully funded, unleveraged bullion exposure; it should not be transferred unchanged to leveraged or inverse products.
NAV and market price describe different observations
Net asset value is a per-share value of the fund’s assets less liabilities under its valuation policy. Market price is what shares trade for on the exchange. Their timing and calculation conventions matter. A premium or discount calculation compares compatible observations: (market price ÷ NAV − 1) × 100. A difference observed using a stale NAV and a current share price can partly reflect timing. The displayed percentage alone does not establish a freely executable arbitrage for an ordinary retail investor.
Calculate a simple purchase premium
Suppose a fictional fund has a same-time NAV of USD 100 and a market offer of USD 101. The offer is 1% above NAV. If NAV later becomes USD 105 but shares can be sold at USD 104, an investor buying at 101 has a 104 ÷ 101 − 1 return of approximately 2.97%, before commissions. That differs from the 5% NAV change. The changing relationship between traded price and NAV is part of the cash outcome. Use actual executable sides when studying a real transaction.
Measure tracking with matching conventions
Tracking difference compares the product’s return with a specified benchmark return over the same period. Expenses, implementation, cash balances, valuation timing and currency treatment may contribute. A hypothetical benchmark gain of 8.0% and fund NAV gain of 7.6% produce a −0.4 percentage-point tracking difference using fund minus benchmark. This number is not the same as tracking error, which concerns variability of return differences under a stated method. Distinguish NAV performance from an investor’s exchange-traded entry and exit result.
Practice task: make three parallel return lines
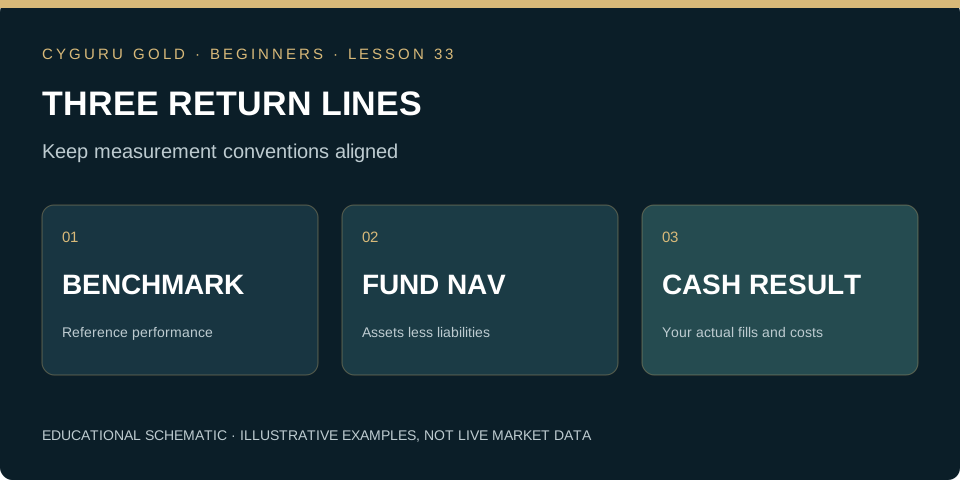
Create one row for benchmark return, one for fund NAV return and one for the investor’s purchase-to-sale cash return. Give each the same start and end dates and state the currency, costs and observation times. Reproduce the invented examples, then identify which differences come from ongoing implementation and which come from purchase or sale terms. Add the product’s structure and redemption rules to the worksheet. Continue with the portfolio lesson to see why an allocation rule needs more than a headline gold return.
Can you apply the idea?
Answer three questions, then check the explanation for every answer. You can repeat the check after reviewing the lesson.
Knowledge check: not attempted
Make this lesson part of your process.
Finish the reading and its practice task, then mark the lesson as completed.
0 of 34 lessons completed
Gold Trading Mastery
From gold market fundamentals to technical analysis, execution, quantitative research and AI. A structured 160-chapter course.
Explore the book →Continue the beginner course
What Is XAU/USD? Gold Trading Explained for Beginners →
How to Read Gold Candlestick Charts: A Beginner’s Guide →
Market, Limit and Stop Orders in Gold Trading →
Gold Trading Costs: Spread, Slippage and Financing →
Stop-Loss and Take-Profit in Gold: Beginner Essentials →
Your First Gold Trading Plan: Practise Before Going Live →
Gold Position Sizing: Calculate Exposure Before You Trade →
Gold Leverage and Margin: Understand the Difference →
Support and Resistance in Gold: Read Zones Without Guessing →
Gold and the Economic Calendar: CPI, Jobs and the Fed →
Multiple-Timeframe Gold Analysis: Context, Setup and Trigger →
Gold Trading Expectancy: Evaluate Results Beyond Win Rate →
Gold Trends and Ranges: Identify the Market Before the Setup →
Gold ATR for Beginners: Measure Movement, Not Direction →
Gold Breakouts and Failed Breaks: Define the Evidence →
Gold Trading Drawdown: Understand Losses and Recovery →
How to Backtest a Gold Trading Rule Without Hindsight →
The Gold Pre-Trade Checklist: Turn a Plan into a Decision →
Gold Liquidity and Trading Sessions: Study the Conditions →
Audit a Gold Trade: Quotes, Triggers and Actual Fills →
Multiple Gold Positions: Measure the Combined Exposure →
Partial Exits and Breakeven Stops: Follow the Arithmetic →
Small Samples in Gold Trading: Describe the Uncertainty →
Your Gold Trading Review: Version the Rule Before Testing Again →
Gold Weight and Purity: Calculate the Fine Gold Content →
Gold Premiums and Buyback: Calculate the Round-Trip Hurdle →
Allocated and Unallocated Gold: Understand the Ownership Claim →
Gold Benchmarks and Spot Quotes: Compare Like with Like →
Gold Returns in Your Currency: Separate Metal and FX Effects →
Gold Futures Tick Value: Translate Price Moves into Money →
Gold Futures Daily Settlement: Follow the Cash Through the Account →
Gold COT Reports: Read Positioning Without Inventing a Signal →
Gold in a Portfolio: Calculate Weight Drift and Rebalancing →
Market Desk and position-risk calculator →
Position sizing explained → · Build a trading journal →
Lesson sources and further study
Investor.gov: Exchange-Traded Funds
Core course references
CME Group: Gold Product Overview. Investor.gov: Types of Orders explains order concepts for stocks; check the execution rules of your specific gold instrument.
Gabriel Nicolaev — CyGuru · Published 5 November 2026. Educational material. Illustrative prices are not current quotes or trade recommendations.