Gold Account Performance: Separate Deposits from Trading Gains
Reconcile account equity with external cash flows and calculate a simple linked return example.
A larger balance is not automatically profit
An account can grow because trades earned money or because additional capital arrived. It can shrink after a profitable period if the owner withdraws funds. Keep deposits and withdrawals separate from trading P&L, fees and open-position valuation changes. A screenshot of the ending balance cannot establish performance without the starting value and the account’s intervening flows.
Reconcile the money first
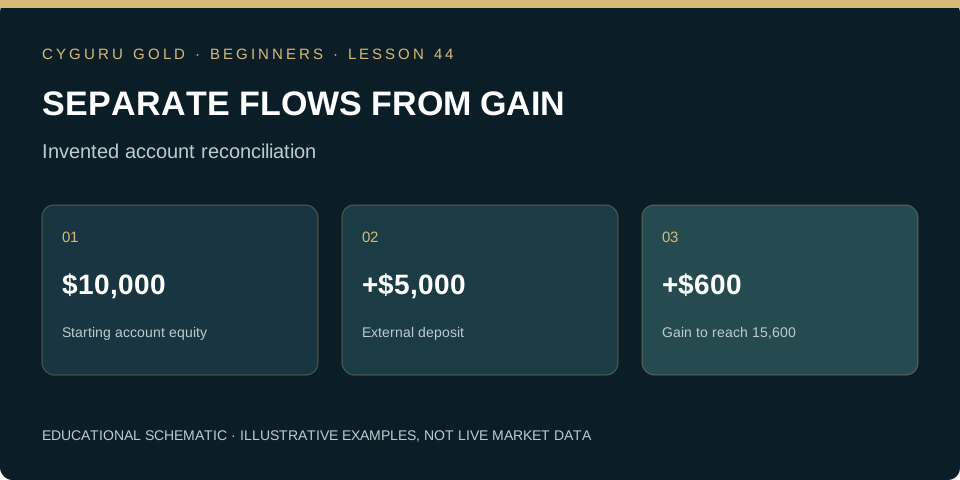
Suppose starting equity is USD 10,000, deposits total USD 5,000, withdrawals are zero and ending equity is USD 15,600. Net economic gain is USD 600 under these assumptions. Dividing USD 5,600 by the original balance would incorrectly label the deposit as profit. This money reconciliation does not yet determine a unique percentage return because the timing of the added capital matters.
Calculate a simple linked return
Assume equity grows from USD 10,000 to USD 10,500, then a USD 5,000 deposit arrives immediately afterward. The next subperiod starts at USD 15,500 and ends at USD 15,600. The subperiod returns are 5% and approximately 0.6452%. Linking them gives 1.05 × (15,600 / 15,500) − 1, approximately 5.68%. The valuation immediately before the flow is essential to this simplified time-weighted example.
Choose the measurement for the question
Time-weighted measurement links subperiod returns to reduce the effect of external flow timing on the measure of investment performance. Money-weighted measurement reflects the size and timing of the investor’s cash flows and needs dated inputs. Different methods can give different valid answers to different questions. Avoid labeling a deposit-adjusted dollar gain as a time-weighted return or presenting one percentage without its method.
Practice task: build a cash-flow ledger
Create a small paper ledger with valuation timestamps, deposits, withdrawals, fees and ending equity. Reconcile the USD 600 gain in the example, then reproduce the linked return using the two subperiods. Explain why the same total deposit arriving at the start would change the return calculation. Preserve the method, missing valuations and assumptions alongside any public performance summary; a clean percentage should remain traceable to the ledger.
Can you apply the idea?
Answer three questions, then check the explanation for every answer. You can repeat the check after reviewing the lesson.
Knowledge check: not attempted
Make this lesson part of your process.
Finish the reading and its practice task, then mark the lesson as completed.
0 of 54 lessons completed
Gold Trading Mastery
From gold market fundamentals to technical analysis, execution, quantitative research and AI. A structured 160-chapter course.
Explore the book →Continue the beginner course
What Is XAU/USD? Gold Trading Explained for Beginners →
How to Read Gold Candlestick Charts: A Beginner’s Guide →
Market, Limit and Stop Orders in Gold Trading →
Gold Trading Costs: Spread, Slippage and Financing →
Stop-Loss and Take-Profit in Gold: Beginner Essentials →
Your First Gold Trading Plan: Practise Before Going Live →
Gold Position Sizing: Calculate Exposure Before You Trade →
Gold Leverage and Margin: Understand the Difference →
Support and Resistance in Gold: Read Zones Without Guessing →
Gold and the Economic Calendar: CPI, Jobs and the Fed →
Multiple-Timeframe Gold Analysis: Context, Setup and Trigger →
Gold Trading Expectancy: Evaluate Results Beyond Win Rate →
Gold Trends and Ranges: Identify the Market Before the Setup →
Gold ATR for Beginners: Measure Movement, Not Direction →
Gold Breakouts and Failed Breaks: Define the Evidence →
Gold Trading Drawdown: Understand Losses and Recovery →
How to Backtest a Gold Trading Rule Without Hindsight →
The Gold Pre-Trade Checklist: Turn a Plan into a Decision →
Gold Liquidity and Trading Sessions: Study the Conditions →
Audit a Gold Trade: Quotes, Triggers and Actual Fills →
Multiple Gold Positions: Measure the Combined Exposure →
Partial Exits and Breakeven Stops: Follow the Arithmetic →
Small Samples in Gold Trading: Describe the Uncertainty →
Your Gold Trading Review: Version the Rule Before Testing Again →
Gold Weight and Purity: Calculate the Fine Gold Content →
Gold Premiums and Buyback: Calculate the Round-Trip Hurdle →
Allocated and Unallocated Gold: Understand the Ownership Claim →
Gold Benchmarks and Spot Quotes: Compare Like with Like →
Gold Returns in Your Currency: Separate Metal and FX Effects →
Gold Futures Tick Value: Translate Price Moves into Money →
Gold Futures Daily Settlement: Follow the Cash Through the Account →
Gold COT Reports: Read Positioning Without Inventing a Signal →
Gold ETFs: NAV, Market Price and Tracking Difference →
Gold in a Portfolio: Calculate Weight Drift and Rebalancing →
Gold Moving Averages: Read Smoothing Without Predicting the Future →
Gold RSI: Momentum Is Not a Reversal Promise →
Gold Volume: Distinguish Ticks, Contracts and Coverage →
Gold Heikin Ashi Charts: Separate Display Prices from Fills →
Gold Indicator Repainting: Distinguish Live Signals from Confirmed History →
Gold Backtests: When One Candle Touches Both Stop and Target →
Gold TradingView Alerts: Audit the Saved Script Snapshot →
Gold Signal Webhooks: Verify Delivery, Freshness and Duplicates →
Gold Trading Returns: Add Money, Compound Percentages →
Gold Realized Volatility: Calculate the Statistic and Audit Its Assumptions →
Gold Correlation: Align Returns Before Interpreting the Relationship →
Gold Event Studies: Measure the Reaction Without Inventing the Cause →
Gold Strategy Robustness: Count the Experiments Behind the Winner →
Gold Stress Tests: Model Gaps, Liquidity and Tail Losses Together →
Gold Options at Expiry: Separate Payoff, Premium and Exercise →
Gold Option Delta and Gamma: Estimate Exposure Without Freezing It →
Gold Implied Volatility: Separate the Price of Uncertainty from Direction →
Gold Futures Rolls: Reconcile Contract P&L with a Continuous Chart →
Gold Mining Shares: Understand the Business Behind the Metal Exposure →
Market Desk and position-risk calculator →
Position sizing explained → · Build a trading journal →
Lesson sources and further study
CFA Institute: GIPS standards for performance measurement
Core course references
CME Group: Gold Product Overview. Investor.gov: Types of Orders explains order concepts for stocks; check the execution rules of your specific gold instrument.
Gabriel Nicolaev — CyGuru · Published 5 November 2026. Educational material. Illustrative prices are not current quotes or trade recommendations.