Gold RSI: Momentum Is Not a Reversal Promise
Interpret RSI thresholds and divergence without confusing a momentum reading with a forecast or a probability.
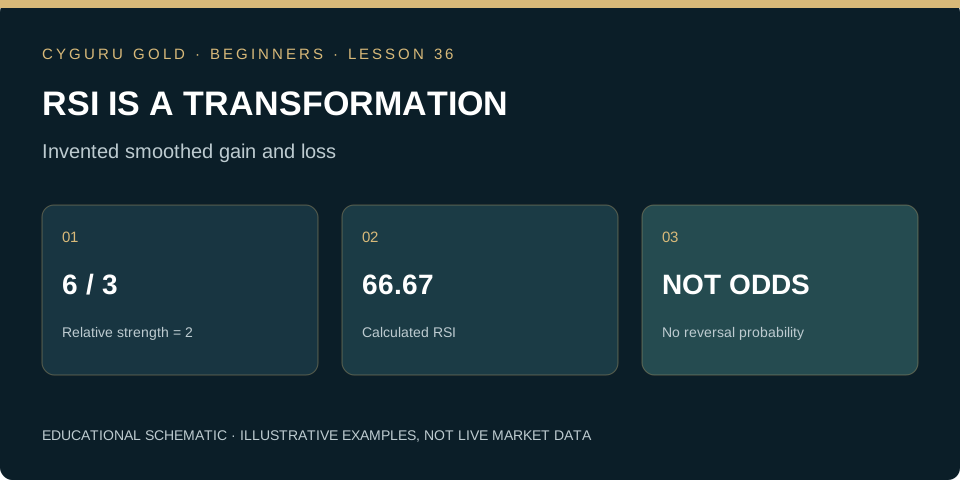
Read the measurement before the label
RSI summarizes smoothed upward and downward changes in a selected price series on a scale from zero to one hundred. Its period and smoothing convention matter. The common words overbought and oversold are labels for regions of the indicator, not orders to sell or buy. A reading of 70 does not mean there is a 70% probability of a decline.
Work through the ratio
Under the standard RSI transformation, relative strength is average gain divided by average loss, and RSI equals 100 minus 100 divided by one plus relative strength. If those smoothed quantities are 6 and 3, relative strength is 2 and RSI is approximately 66.67. These are invented inputs for understanding the calculation, not a complete initialization example. Zero-loss and initialization cases need the platform’s documented handling.
Place the threshold in market context
Momentum can remain elevated while gold continues higher, or remain weak during a sustained decline. A threshold touch alone does not identify the turning point. Before testing a threshold rule, specify whether the event is entering the region, leaving it or crossing on a completed bar. These are different conditions with different event counts and timing. Keep the same interpretation throughout the evaluation.
Treat divergence as a defined comparison
A higher price high paired with a lower RSI high is often called bearish divergence. It describes two comparisons; it does not establish when price must reverse. Swing selection can introduce hindsight if a pivot requires later bars for confirmation. Record when each pivot became knowable and where a decision could actually occur. A divergence identified only after the drop cannot justify an earlier simulated entry.
Practice task: document the missing rule
Choose a fixed RSI period and two predefined threshold events. Record ten observations with the candle state, trend context and later outcomes kept in separate columns. Explain why the same number can occur in different price environments. Do not optimize the period during the exercise. Write the risk, entry and exit conditions still missing from the indicator reading before describing it as a trading system.
Can you apply the idea?
Answer three questions, then check the explanation for every answer. You can repeat the check after reviewing the lesson.
Knowledge check: not attempted
Make this lesson part of your process.
Finish the reading and its practice task, then mark the lesson as completed.
0 of 54 lessons completed
Gold Trading Mastery
From gold market fundamentals to technical analysis, execution, quantitative research and AI. A structured 160-chapter course.
Explore the book →Continue the beginner course
What Is XAU/USD? Gold Trading Explained for Beginners →
How to Read Gold Candlestick Charts: A Beginner’s Guide →
Market, Limit and Stop Orders in Gold Trading →
Gold Trading Costs: Spread, Slippage and Financing →
Stop-Loss and Take-Profit in Gold: Beginner Essentials →
Your First Gold Trading Plan: Practise Before Going Live →
Gold Position Sizing: Calculate Exposure Before You Trade →
Gold Leverage and Margin: Understand the Difference →
Support and Resistance in Gold: Read Zones Without Guessing →
Gold and the Economic Calendar: CPI, Jobs and the Fed →
Multiple-Timeframe Gold Analysis: Context, Setup and Trigger →
Gold Trading Expectancy: Evaluate Results Beyond Win Rate →
Gold Trends and Ranges: Identify the Market Before the Setup →
Gold ATR for Beginners: Measure Movement, Not Direction →
Gold Breakouts and Failed Breaks: Define the Evidence →
Gold Trading Drawdown: Understand Losses and Recovery →
How to Backtest a Gold Trading Rule Without Hindsight →
The Gold Pre-Trade Checklist: Turn a Plan into a Decision →
Gold Liquidity and Trading Sessions: Study the Conditions →
Audit a Gold Trade: Quotes, Triggers and Actual Fills →
Multiple Gold Positions: Measure the Combined Exposure →
Partial Exits and Breakeven Stops: Follow the Arithmetic →
Small Samples in Gold Trading: Describe the Uncertainty →
Your Gold Trading Review: Version the Rule Before Testing Again →
Gold Weight and Purity: Calculate the Fine Gold Content →
Gold Premiums and Buyback: Calculate the Round-Trip Hurdle →
Allocated and Unallocated Gold: Understand the Ownership Claim →
Gold Benchmarks and Spot Quotes: Compare Like with Like →
Gold Returns in Your Currency: Separate Metal and FX Effects →
Gold Futures Tick Value: Translate Price Moves into Money →
Gold Futures Daily Settlement: Follow the Cash Through the Account →
Gold COT Reports: Read Positioning Without Inventing a Signal →
Gold ETFs: NAV, Market Price and Tracking Difference →
Gold in a Portfolio: Calculate Weight Drift and Rebalancing →
Gold Moving Averages: Read Smoothing Without Predicting the Future →
Gold Volume: Distinguish Ticks, Contracts and Coverage →
Gold Heikin Ashi Charts: Separate Display Prices from Fills →
Gold Indicator Repainting: Distinguish Live Signals from Confirmed History →
Gold Backtests: When One Candle Touches Both Stop and Target →
Gold TradingView Alerts: Audit the Saved Script Snapshot →
Gold Signal Webhooks: Verify Delivery, Freshness and Duplicates →
Gold Trading Returns: Add Money, Compound Percentages →
Gold Account Performance: Separate Deposits from Trading Gains →
Gold Realized Volatility: Calculate the Statistic and Audit Its Assumptions →
Gold Correlation: Align Returns Before Interpreting the Relationship →
Gold Event Studies: Measure the Reaction Without Inventing the Cause →
Gold Strategy Robustness: Count the Experiments Behind the Winner →
Gold Stress Tests: Model Gaps, Liquidity and Tail Losses Together →
Gold Options at Expiry: Separate Payoff, Premium and Exercise →
Gold Option Delta and Gamma: Estimate Exposure Without Freezing It →
Gold Implied Volatility: Separate the Price of Uncertainty from Direction →
Gold Futures Rolls: Reconcile Contract P&L with a Continuous Chart →
Gold Mining Shares: Understand the Business Behind the Metal Exposure →
Market Desk and position-risk calculator →
Position sizing explained → · Build a trading journal →
Lesson sources and further study
CME Group: Oscillators — MACD, RSI, Stochastics
Core course references
CME Group: Gold Product Overview. Investor.gov: Types of Orders explains order concepts for stocks; check the execution rules of your specific gold instrument.
Gabriel Nicolaev — CyGuru · Published 5 November 2026. Educational material. Illustrative prices are not current quotes or trade recommendations.