Gold Strategy Robustness: Count the Experiments Behind the Winner
Evaluate parameter stability, disclose repeated searches and keep a final holdout from becoming another optimization sample.
The winning result has a selection history
A strategy that wins one comparison is different from a strategy selected as the best of hundreds. Searching more rules gives noise more opportunities to look impressive. The relevant record includes discarded thresholds, timeframes, instruments, stop settings and data-cleaning choices, not only the final version. Some choices are made by visual inspection rather than an optimizer, but they still use information from the sample. Write an experiment ledger before testing so the eventual result can be evaluated in the context of the search that produced it.
Use probability arithmetic without misusing it
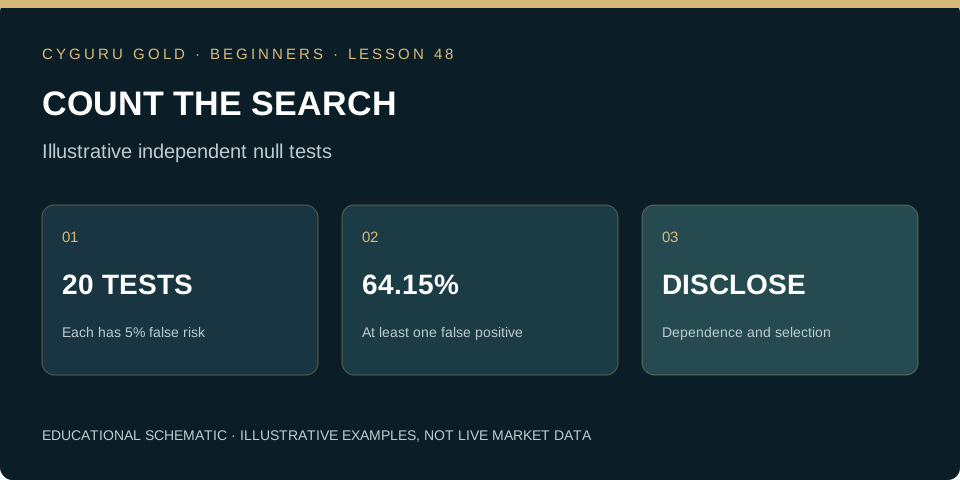
Imagine twenty genuinely independent tests, each having a 5% false-positive probability under a stated null model. The probability of at least one false positive is 1 − 0.95 raised to the twentieth power, approximately 64.15%. This is a teaching illustration of repeated-testing risk, not the measured probability that your gold strategy is false. Real trading trials often overlap, and their dependence changes the arithmetic. A reported p-value also requires a valid statistical model. The lesson is to account for selection, not to attach this exact percentage to every optimization exercise.
Inspect a neighborhood rather than one peak
Suppose a predefined parameter grid gives net expectancy of −0.10R, +0.30R and −0.08R at settings 18, 20 and 22. The isolated favorable middle setting deserves investigation. A broader neighborhood of modest positive results would be a different pattern, although not proof of robustness. Compare equivalent periods, exposure and cost assumptions, and report trade counts for each setting. Large changes in trade composition can explain apparent instability. Do not expand the grid repeatedly until a plateau appears and then describe that region as if it had been specified from the beginning.
| Item | Record | Interpretation |
|---|---|---|
| Illustrative search | 20 independent null tests | A stated model, not a measured trading probability |
| At least one false positive | 1 − 0.95²⁰ ≈ 64.15% | Shows why trial counts matter |
| Setting 18 | −0.10R net expectancy | Predeclared grid example |
| Setting 20 | +0.30R net expectancy | Investigate the isolated favorable setting |
| Setting 22 | −0.08R net expectancy | Check counts and trade composition |
Protect the role of each data segment
Training data can support rule selection; a validation segment can help compare development choices; a final holdout is meant to evaluate the frozen candidate. Once results from the holdout guide another change, that segment has participated in selection. Calling it out of sample afterward does not restore independence. Time-series splits also need attention to overlapping labels, long holding periods and the information available when a trade is formed. A random shuffle can place related episodes on both sides of a split. Document chronological boundaries and any exclusion gap needed by the particular method.
Combine statistical checks with operational plausibility
An attractive average can vanish when realistic spread, slippage, financing or missed fills are included. Stress plausible costs according to the instrument and session, and explain their source. Verify that the rule uses no future bars, survives reasonable data corrections and has a coherent execution path. Robustness is not a badge earned by passing a fixed number of checks. It is an argument supported by converging evidence whose limitations remain visible. A complicated model may fit more historical detail while leaving less information for independent evaluation; complexity should earn its place through a documented comparison.
Practice task: review the complete search
Construct an imaginary ledger of ten rule variants, including their selection dates, parameter choices, usable trades and net results. Choose a candidate using a criterion written before the comparison, then reserve a later segment without inspecting it. Write what you will do after a disappointing holdout result without silently retuning against it. Reproduce the 64.15% illustration and explicitly state its independence assumption. Your final memo should include all trials, the parameter neighborhood, cost sensitivity and the remaining uncertainty. A candidate may merit further paper testing without yet supporting a claim of dependable live profitability.
Can you apply the idea?
Answer three questions, then check the explanation for every answer. You can repeat the check after reviewing the lesson.
Knowledge check: not attempted
Make this lesson part of your process.
Finish the reading and its practice task, then mark the lesson as completed.
0 of 54 lessons completed
Gold Trading Mastery
From gold market fundamentals to technical analysis, execution, quantitative research and AI. A structured 160-chapter course.
Explore the book →Continue the beginner course
What Is XAU/USD? Gold Trading Explained for Beginners →
How to Read Gold Candlestick Charts: A Beginner’s Guide →
Market, Limit and Stop Orders in Gold Trading →
Gold Trading Costs: Spread, Slippage and Financing →
Stop-Loss and Take-Profit in Gold: Beginner Essentials →
Your First Gold Trading Plan: Practise Before Going Live →
Gold Position Sizing: Calculate Exposure Before You Trade →
Gold Leverage and Margin: Understand the Difference →
Support and Resistance in Gold: Read Zones Without Guessing →
Gold and the Economic Calendar: CPI, Jobs and the Fed →
Multiple-Timeframe Gold Analysis: Context, Setup and Trigger →
Gold Trading Expectancy: Evaluate Results Beyond Win Rate →
Gold Trends and Ranges: Identify the Market Before the Setup →
Gold ATR for Beginners: Measure Movement, Not Direction →
Gold Breakouts and Failed Breaks: Define the Evidence →
Gold Trading Drawdown: Understand Losses and Recovery →
How to Backtest a Gold Trading Rule Without Hindsight →
The Gold Pre-Trade Checklist: Turn a Plan into a Decision →
Gold Liquidity and Trading Sessions: Study the Conditions →
Audit a Gold Trade: Quotes, Triggers and Actual Fills →
Multiple Gold Positions: Measure the Combined Exposure →
Partial Exits and Breakeven Stops: Follow the Arithmetic →
Small Samples in Gold Trading: Describe the Uncertainty →
Your Gold Trading Review: Version the Rule Before Testing Again →
Gold Weight and Purity: Calculate the Fine Gold Content →
Gold Premiums and Buyback: Calculate the Round-Trip Hurdle →
Allocated and Unallocated Gold: Understand the Ownership Claim →
Gold Benchmarks and Spot Quotes: Compare Like with Like →
Gold Returns in Your Currency: Separate Metal and FX Effects →
Gold Futures Tick Value: Translate Price Moves into Money →
Gold Futures Daily Settlement: Follow the Cash Through the Account →
Gold COT Reports: Read Positioning Without Inventing a Signal →
Gold ETFs: NAV, Market Price and Tracking Difference →
Gold in a Portfolio: Calculate Weight Drift and Rebalancing →
Gold Moving Averages: Read Smoothing Without Predicting the Future →
Gold RSI: Momentum Is Not a Reversal Promise →
Gold Volume: Distinguish Ticks, Contracts and Coverage →
Gold Heikin Ashi Charts: Separate Display Prices from Fills →
Gold Indicator Repainting: Distinguish Live Signals from Confirmed History →
Gold Backtests: When One Candle Touches Both Stop and Target →
Gold TradingView Alerts: Audit the Saved Script Snapshot →
Gold Signal Webhooks: Verify Delivery, Freshness and Duplicates →
Gold Trading Returns: Add Money, Compound Percentages →
Gold Account Performance: Separate Deposits from Trading Gains →
Gold Realized Volatility: Calculate the Statistic and Audit Its Assumptions →
Gold Correlation: Align Returns Before Interpreting the Relationship →
Gold Event Studies: Measure the Reaction Without Inventing the Cause →
Gold Stress Tests: Model Gaps, Liquidity and Tail Losses Together →
Gold Options at Expiry: Separate Payoff, Premium and Exercise →
Gold Option Delta and Gamma: Estimate Exposure Without Freezing It →
Gold Implied Volatility: Separate the Price of Uncertainty from Direction →
Gold Futures Rolls: Reconcile Contract P&L with a Continuous Chart →
Gold Mining Shares: Understand the Business Behind the Metal Exposure →
Market Desk and position-risk calculator →
Position sizing explained → · Build a trading journal →
Lesson sources and further study
Bailey, Borwein, López de Prado and Zhu: The Probability of Backtest Overfitting
Core course references
CME Group: Gold Product Overview. Investor.gov: Types of Orders explains order concepts for stocks; check the execution rules of your specific gold instrument.
Gabriel Nicolaev — CyGuru · Published 6 November 2026. Educational material. Illustrative prices are not current quotes or trade recommendations.