The balance rose, but did trading profit?
Reconcile a deposit and open P&L before describing performance.
Illustrative simulation · No historical performance claim01. Read the information available.
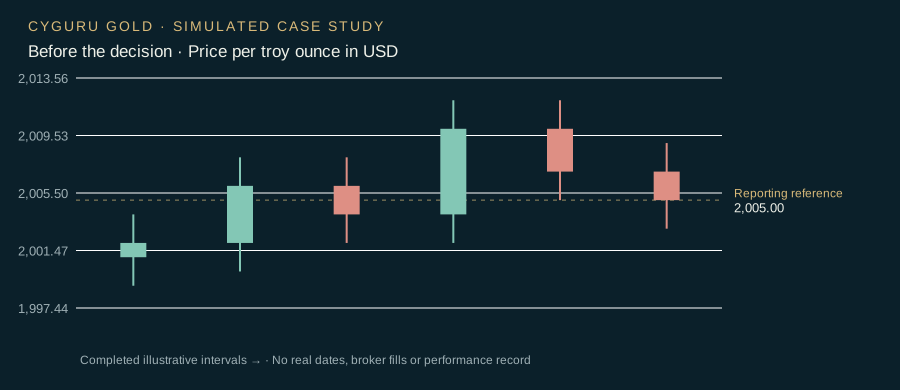
A synthetic report begins with USD 10,000 equity. An external USD 500 deposit has arrived. Four completed programs show net outcomes +80, −50, +40 and −30 dollars. A position remains open and will be marked at the reporting cutoff. The visible market chart cannot by itself establish account deposits, quantities or net results; those are ledger inputs supplied by the case.
02. Apply the documented plan.
Before making a performance claim, reconcile closed net results, the open mark and external flows. Use the stated valuation convention and retain the timestamp. A percentage return requires cash-flow timing and a defined methodology; do not automatically divide a convenient equity change by starting capital.
Ending equity USD 10,470; economic P&L −USD 30
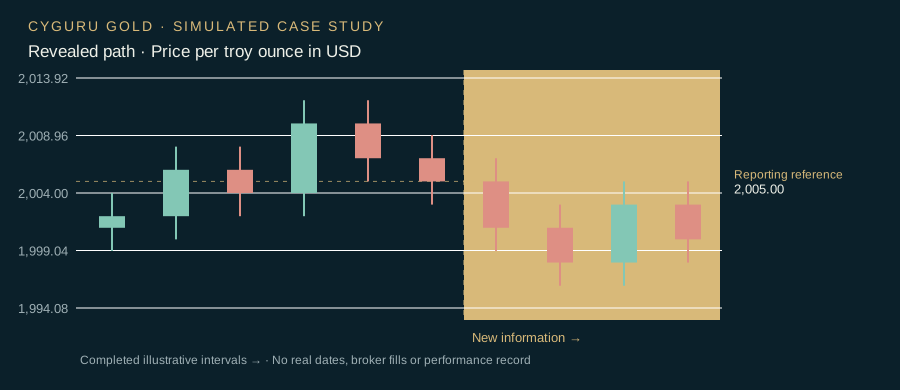
At the cutoff, the stipulated open mark is −USD 70. Closed net results total +USD 40, so economic P&L is 40−70=−USD 30. Ending equity is 10,000+500+40−70=USD 10,470. The USD 470 equity increase includes the deposit and is not trading profit. The later synthetic chart does not change that reporting cutoff or supply a return percentage without the missing cash-flow timing.
Reproduce the calculation
| Component | Calculation or state |
|---|---|
| Closed net | 80−50+40−30 = USD 40 |
| Open mark | −USD 70 |
| Economic P&L | −USD 30 |
| Ending equity | USD 10,470 after deposit |
Use the case facts and their units. Chart movement alone does not prove execution or account cash flows.
What this case teaches
A dashboard can be arithmetically correct yet misleading if it labels balance growth as performance. Reconcile every component, state the cutoff and keep hypothetical signals distinct from executed account evidence.
Your reviewed scenarios are saved in this browser.